The Storytelling Suite (STS) comprises two major components: The Story Creator and the Story Viewer. Together, they form a dynamic platform that leverages the power of cultural heritage data to create engaging narratives that bridge the past and the present, while seamlessly communicating interdisciplinary findings to diverse audiences.
The Story Creator is the portal to the (hi)stories, a tool that allows you to weave stories from the vast tapestry of cultural heritage data. This data includes entities such as individuals, objects, groups, and places, along with the events that have shaped their histories. With this creative tool, you can transform data into interactive visualizations and engaging narratives in a slideshow-based storytelling. With multimedia annotations and interactive visualization, the stories allow you to communicate the results of interdisciplinary data analysis in a way that resonates with people from various backgrounds.
The Story Viewer is where your narratives come to life. It provides a medium for audiences to explore, experience, and appreciate the interconnectedness of our world’s cultural heritage. You can effortlessly share your stories with a broad spectrum of audiences, fostering a deeper understanding of our shared human and culture history.
As you embark on this tutorial, you will discover the potential of our Storytelling Suite and how it can transform raw cultural heritage data into vivid, memorable narratives. Whether you’re a historian, a data analyst, a teacher, or simply a curious explorer, this tool empowers you to bridge the gap between data and storytelling. Dive in, create, explore, and let the power of narratives bring cultural heritage to life …
Story Overview
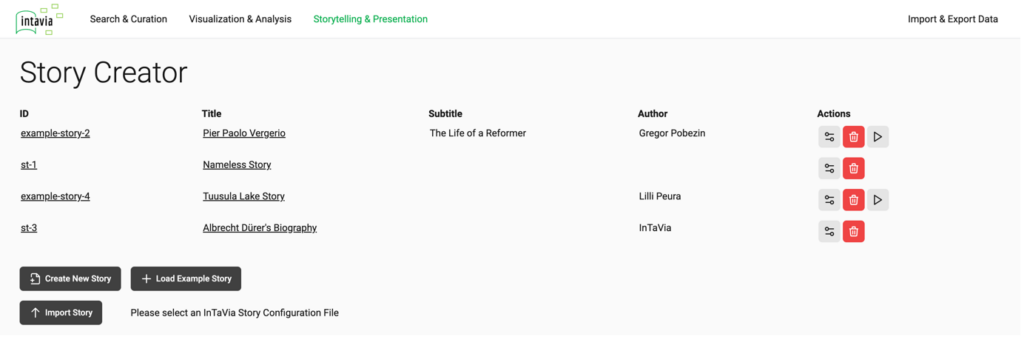
Each story represents a slide show consisting of slides creating a sequence of interactive visualizations and narrative information in form of multi-media annotations like text, audio, or video. The starting homepage of the Storytelling Suite in the InTaVia frontend prototype, the Story Overview, list all existing stories and enables the creation of new or the import and organization of existing stories.
Story Creation
The story slide shows can be crafted in the InTaVia Story Creator. To begin a new story, we first state meta information such as Title, Author, and Copyright. In our example we will create some story slides with a manually curated and imported dataset on Albrecht Dürer. After the creation of the new and empty story it appears in the story overview, from where we can jump into the edition of it by clicking on its name.
Slide Editor
The central part of the Story Creator is the Slide Editor where users can craft the single slides for the slideshow story. The Slide Editor makes use of the data panel to the right, a preview of the actual selected slide in the center and the Story Flow on the right, showing an overview of the story’s slides sequence. On top of the Slide Editor is the toolbar for the current edited story, allowing to change the layout, downloading the Story Script, playing the Story in the Story Viewer, or alter the settings and meta-information of the story. Each of the slides consists of interactive visualizations, and multimedia content chunks, or their juxtaposition.
Visualization Panels and Interactive Visualizations
The narrative slideshows are meant to make use of the cultural heritage data in form of interactive visualizations. Therefore the slides are able to include up to one visualization panel, symbolized by the white background. This panel utilizes the Visualization Wizard known from the Visual Analytics Studio (VAS) and allows to create new visualizations (timeline, map, network graph) or the import of already existing visualization in the system from the VAS or previous story slides. All of the visualizations have an option dialog for further settings, reachable by the according icon in the toolbar on top of the visualization panel. The data in from of entities and their related events can be added to the visualizations by drag and drop interactions or the click on the according “plus” buttons.
Content Panels and Content Chunks
Additionally, to the visualization panel, each slide can have up to two content panels, symbolized by the blue background. These content panels represent the space for the arrangement of additional multimedia content chunks in the slide layout. The content chunks can be created via the Content Wizard, offering Text, Image, Quiz, Video/Audio, and customizable HTML container as options. The single content chunks within one content panel can be rearranged and resized by drag and drop mouse interactions. Analog to the visualizations each content chunk has additional options to further define the characteristics of it.
First Slide
When starting to edit a new story we are presented by the first empty slide with a proposed layout of a visualization on the leftside (white area) and an area for content annotations (blue area) on the right. Here we start with an overview over Albrecht Dürer’s life in a timeline. Therefore, we create a new and empty timeline by a button click. After selecting our wished collection in the Data Panel on the left, we are able to browse the contained entities and select Albrecht Dürer as person. By dragging his list entry and dropping it over the timeline, we are adding all his related events to the timeline.
Highlight Events for Seamless Transitions
To configure seamless transition within one visualization throughout different slides, we are selecting focus events to zoom on, as we see here with the birth event. To mark and highlight single events in the timeline (and map) visualization it needs one click. The marked event will be highlighted with a bold label and a yellow outline. In the resulting preview in the Story Viewer(external) the visualization will zoom automatically onto the highlighted events (they can be multiple), so that they are insidethe view extent of the visualization component. So that the camera would zoom and pan into the timeline to highlight the birth event within its context.
Text Annotation
To describe the birth event by a text, consisting of a title and text, acting as our narrative thread, we are creating a new text content element on the right, blue side. The title and the text can be added or edited by clicking into the placeholders (or texts) itself. Here we are contextualizing the birth event of Albrecht Dürer.
Add Slides
To add a second slide, we have to use the “Add Slide” button on the bottom of the Story Flow to the right. This is also the space where the order of slides can be changed, and slides can be duplicated or deleted. Through this slide overview we also change the selected slide in the main part of the slide editor to adjust the contents.
Include Existing Visualizations (Reuse)
In the visualization wizard there is an option to add already existing visualizations, which were created in the Visual Analytics Studio or within previous slides. By scrolling through the dropdown menu, we can select timeline, map and network visualizations, grouped regarding their type. After clicking the button “Add Visualization”, the existing visualization will be duplicated and included in this visualization container for the reuse of it. In this case the map is showing an already customized map view showing an overview over the business-oriented journey of Albrecht Dürer towards and through the Netherlands.Notable here is that the view extent of the map visualization and the current zoom level are saved within the visualization properties so that they can be loaded and applied later or while replaying the story in the Story Viewer. This behavior can then also be used to enforce specific camera pans or level of detail within the spatial narration.
Image Annotation
To make the visualized trip to the Netherlands by Albrecht Dürer more tangible we are adding an image as content chunk to our slide. This is done by first, adding a new, empty image on the right, blue content pane. Afterwards we are editing the details of it by utilizing the settings button on the top right corner of the image placeholder. There we can link to the image resource hosted externally by stating a web link to it. To add more context to the narration, we are also adding a descriptive text as caption to the image.
Slide Layout
The default layout of one white visualization panel and one blue panel for contents is only a proposal. In fact the layout of each single slide can be changed by the “Layout” button on top of the slide preview. By clicking it, a popup is displaying the four different options using the same color coding as thumbnail previews next to title and short description. Here we are changing the layout to two blue content panels next to each other.
Two Contents Next To Each Other
We are using the changed layout (two columns of content panels) to configure the slide so that we have an image on the left (the left contents are limited to one) and further annotation on the right. After adding the empty image on the left we are statingthe link to a painting of the Austrian city Innsbruck where Albrecht Dürer went to on his travels towards the Netherlands.
Quiz Annotation
On the right of the two columns content layout (with an image on the left) we are creating a multiple-choice quiz by clicking “Quiz” at the content wizard. The detail setting screen of the quiz features an option to state questions by text input. The multiple answers are stated as well by text fields accompanied by checkboxes to select the correct answer. In this case we are asking the question in the context of the adjacent image of Innsbruck. The quiz is previewed then in the story creator with colorcoded correct and wrong answers.
HTML Container Annotation (3D Model Preview)
Towards the end of Albrecht Dürer’s story we are annotating his death and burial by a three-dimensional representation of his grave. For that we are utilizing the flexible Hypertext Markup Language (HTML) container where the users can include any HTML content, which is then rendered as part of the story slide. Utilizing this technique, we are going to include a 3D model preview for a three-dimensional surface model of Albrecht Dürer’s grave hosted on Sketchfab, by using an HTML iFrame.
Video/Audio Annotation
Further multi-media contents can be added via the Video/Audio content chunk. Similar to the configuration of an image, the content itself is only linked by presenting an URL link. Additionally, for the replay of the content users can state the starting second via the content settings to directly jump to the important part within the medium.
Download of Story Scripts
The download button on the top of the slide editor allows the users to preview and download the story script as JSON (JavaScript Object Notation) to persistent the created stories, including all needed information and data. The downloaded JSON file can be imported then afterwards again or sent to someone else.
Upload/Import of Story Scripts
To import an exported and downloaded story script the Story Overview has an upload button. After the selection of a fitting JSON (JavaScript Object Notation) file, it will be processed, and the story is added to the Story Overview list.
Import of Examples
The five representative and manually curated InTaVia Story Use Cases are available for import via the interface of the Story Creator as well. Therefore, an additional button in the Story Overview exists, which activates a drop-down menu where we can select the wished showcase story as template and inspiration for further development.
Play and Publish Stories via the Story Viewer
The created stories can be previewed and played in a responsive manner via the Story Viewer, an external application, via the play button on top of the slide editor. By pressing the button, the story is sent as Story Script to the Story Viewer, where it is stored in a database for later use. The response is a link to the interactive story via the according ID. The link is opened in a new tab, so that the story can be previewed and reviewed smoothly. This play button can be also found in the Story Overview next to the stories in case of the example use cases.
How to create a story viewer component with the data created in the story creator
The SQL database / API for the viewer is only used to store the stories and make them available. If a user wants to create a viewer component themselves, they need the JSON files created in the Story Creator. If someone wants to store their JSONS in any database, they can do so.